


Posted: 29th April 2019
On the 18 April 2019, the FCA released its second set of complaints data for 2018 (H2). Made up of data from individual firms that reported 500 or more complaints over six months, this set paints a rather different picture to that released for the first half of 2018 (H1).
While the volume of complaints, in general, remains high (still within the millions), some of the most complained-about products are actually seeing fewer complaints, as compared to the previous six-month period. As the volume of total complaints begins to wane slightly, so has the total amount of redress paid by companies – likely a welcome step-change within many markets.
Several factors may have contributed to this positive shift but it’s clear that the 8% reduction in Payment Protection Insurance (PPI) complaints volumes has been a major contributor to the reduction. Broader ‘business as usual’ complaints still remaining relatively steady.
Some firms have, however, shown strong progress in reducing broader complaints. It is likely that such firms are performing more effective root cause analysis (RCA) and stopping complaints from emerging in the first instance. Other factors at play may also include a reduction in claims management activity, which may have contributed to the lower numbers.
Whatever the reason, it is encouraging to see that a continuing upward trend has, for the moment, been reversed. Of course, it remains to be seen if we will see the trend-line dive any further over the next few half-years, so firms should not be resting on their laurels. In fact, for some industries and providers of certain products, they will have to be more vigilant than ever if they wish to lower their complaints volumes.
Let’s get down to the numbers ...
The centrepiece statistic of this half-year’s data is the decrease of 5% in the volume of total complaints received by reporting firms (from 4.13 million in H1 2018 to 3.91 million in H2 2018).
PPI remains the most widely complained-about product (1,581,849 complaints in H2 2018), but this figure has fallen, dropping 8% from 1.72 million in H1 2018. This should not come as a massive surprise, but it is very possible that this figure could rise once again before the August 2019 time-bar (something that would be evident in either the H1 or H2 2019 data). A final PPI surge could take firms that aren’t on guard, or those that are ratcheting down ahead of the deadline, by surprise.
Still, even with a drop in complaints, the amount of redress paid out for PPI remains staggeringly high. Firms paid just shy of £2 billion worth of redress over PPI complaints during the H2 period. This number makes up 88% of all redress paid for complaints upheld in the half-year.
Complaints relating to current accounts are also down (around 12%), though this can be explained by the sudden spike, in H1, following large-scale technical issues that impacted customers around the country.
Though complaints volumes are down in general, many sectors and products, once again, saw a rise. Motor and transport insurance complaints rose by 12.5%, while credit card-related complaints also grew by 10.5%.
Complaints, in general, still take some time to be resolved, though the timetables are tightening. In H1 2018, for example, most complaints were resolved within the allotted eight-week time period (92%), but that has increased slightly to 95%, meaning firms are getting better at closing sooner in the complaint’s lifecycle. 37% of complaints were resolved within three days in this last half-year, up from 35% in the previous.
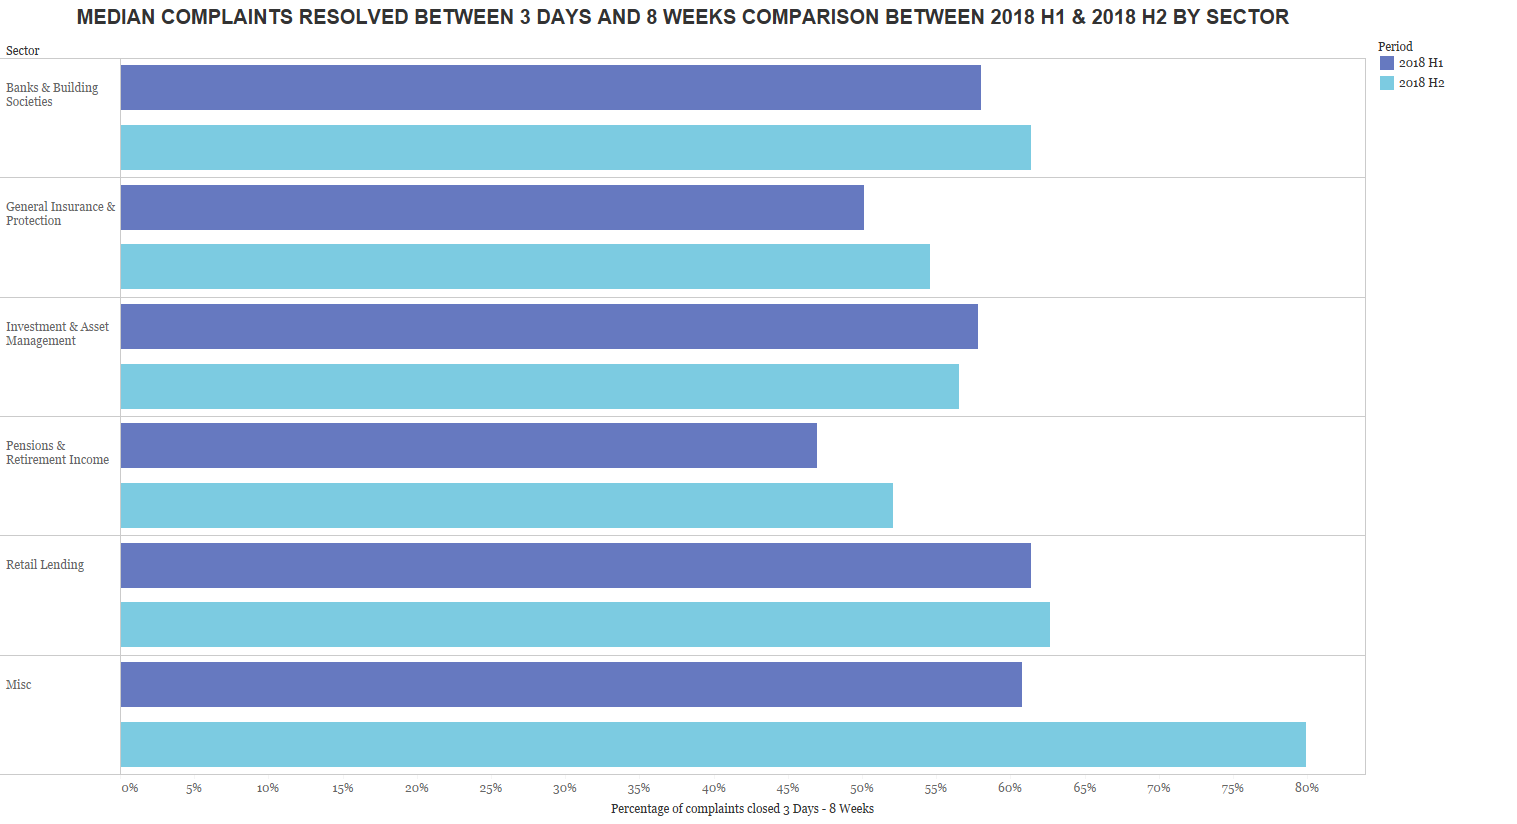
PPI complaints still take considerably longer to resolve than average, with only 7% of these closed within three days. Firms have considerably improved in terms of meeting the eight-week window, however, with only 3% of PPI complaints left open past this limit (as compared to 11% in H1).
The FCA also calculates the proportion of complaints made within each group, allowing them to benchmark across different firms with a greater degree of accuracy. Insurance and Protection, for example, saw 9.6 complaints per 1,000 policies sold (61% of all complaints in H2), while banking and credit cards received 4.6 complaints per 1,000 accounts (33% of all complaints). While making up only 3% of total complaints, home finance attracted close to 10 complaints per 1,000 balances outstanding, highlighting a potential issue within this market.
What the numbers are telling us
While some sectors and certain providers may remain under increasing pressure to keep complaints volumes down, many will be breathing sighs of relief that some of the weight has lifted.
But this has not come about without significant effort on the part of firms and third-party complaints handlers, and it will not be an easy task to keep them at a manageable level.
As noted at the introduction of this article, firms cannot start relaxing, or letting resource flow away from complaints management, at least not just yet. If they are planning to shift resource away from PPI (as will likely be happening in many businesses), for example, they will need contingency resource ready to handle any unforeseen spikes in complaints. As we can all appreciate, a downward trend will not necessarily continue forever – or even for very long.
What the numbers are suggesting is that firms are beginning to take onboard the importance of RCA and implement it as part of the operational day-to-day. Historically, firms have been more reactive than proactive in their handling of complaints, often looking to tackle the symptoms of an issue rather than the root cause.
Effective RCA has great potential benefits, reducing regulatory and operational risk, increasing customer loyalty and encouraging customer advocacy. At the core of RCA is detailed and thorough management information, a suite of evidence that firms can use to identify where issues are occurring in the customer lifecycle, what activities are already being undertaken and what the projected outcome of the completed change-project might be.
Could fewer complaints actually be a bad thing?
It should also be remembered that low complaints volumes aren’t always a good thing. Firms that make themselves difficult to complain to not only face reputational and commercial risks, but they can also exacerbate the issues that led to complaints in the first place.
A study by the Research Locker – based on a set of nearly 500 complaints at a large insurance firm – found that ease of resolution was a key driver of the likelihood to remain and recommend an organisation. Ease of resolution varied according to several factors, such as the number of touchpoints and case duration, through to the ease of communicating and logging a complaint.
The researcher’s analysis found that the ‘revenue risk’ of customers in their sample whose complaint was easily resolved was less than a third of that of customers whose complaints were hard to resolve. Revenue at risk varies dramatically depending on the ease of the complaints journey.
Firms in all sectors need to ensure they are looking below the ‘complaints iceberg’, not simply looking at complaints that are made, but also looking into their root causes and understanding the customer sentiment of non-complainants.
So, while it’s encouraging to see fewer complaints being made – perhaps taken by many as a sign that firms are tightening up their RCA processes and improving customer journeys – complaints volumes alone are a crude metric. They need to be considered alongside other valuable sources of customer insight and management information.

Huntswood - Insight
Related Content

Complaints
Regulatory update: FOS complaints data H1 2019
The Financial Ombudsman Service has published its complaints data for H1 2019

Complaints
Building a ‘smart’ complaints function – The role of technology in complaint handling
The information revolution is already here. So why do so many customers feel their provider isn't taking advantage of new technology?

General regulation
Regulatory update: Financial Ombudsman Service Annual Review 2018 / 19
The FOS has shared its Annual Review of 2018 / 19, highlighting just how busy these past years have been!
Complaints
Infographic: Are you really delivering complaints excellence?
Huntswood research suggests there is a large disconnect between firms' and customers' understanding of how well complaints are being resolved